How neet2seat processes 407,000+ allotment records into actionable guidance
Every prediction, cutoff range, and college classification on neet2seat is derived from publicly available allotment data published by state counselling authorities. We do not survey students, scrape social media, or use self-reported data. The underlying dataset is deterministic: official PDF documents listing every candidate allotted in every round, at every college, in every category.
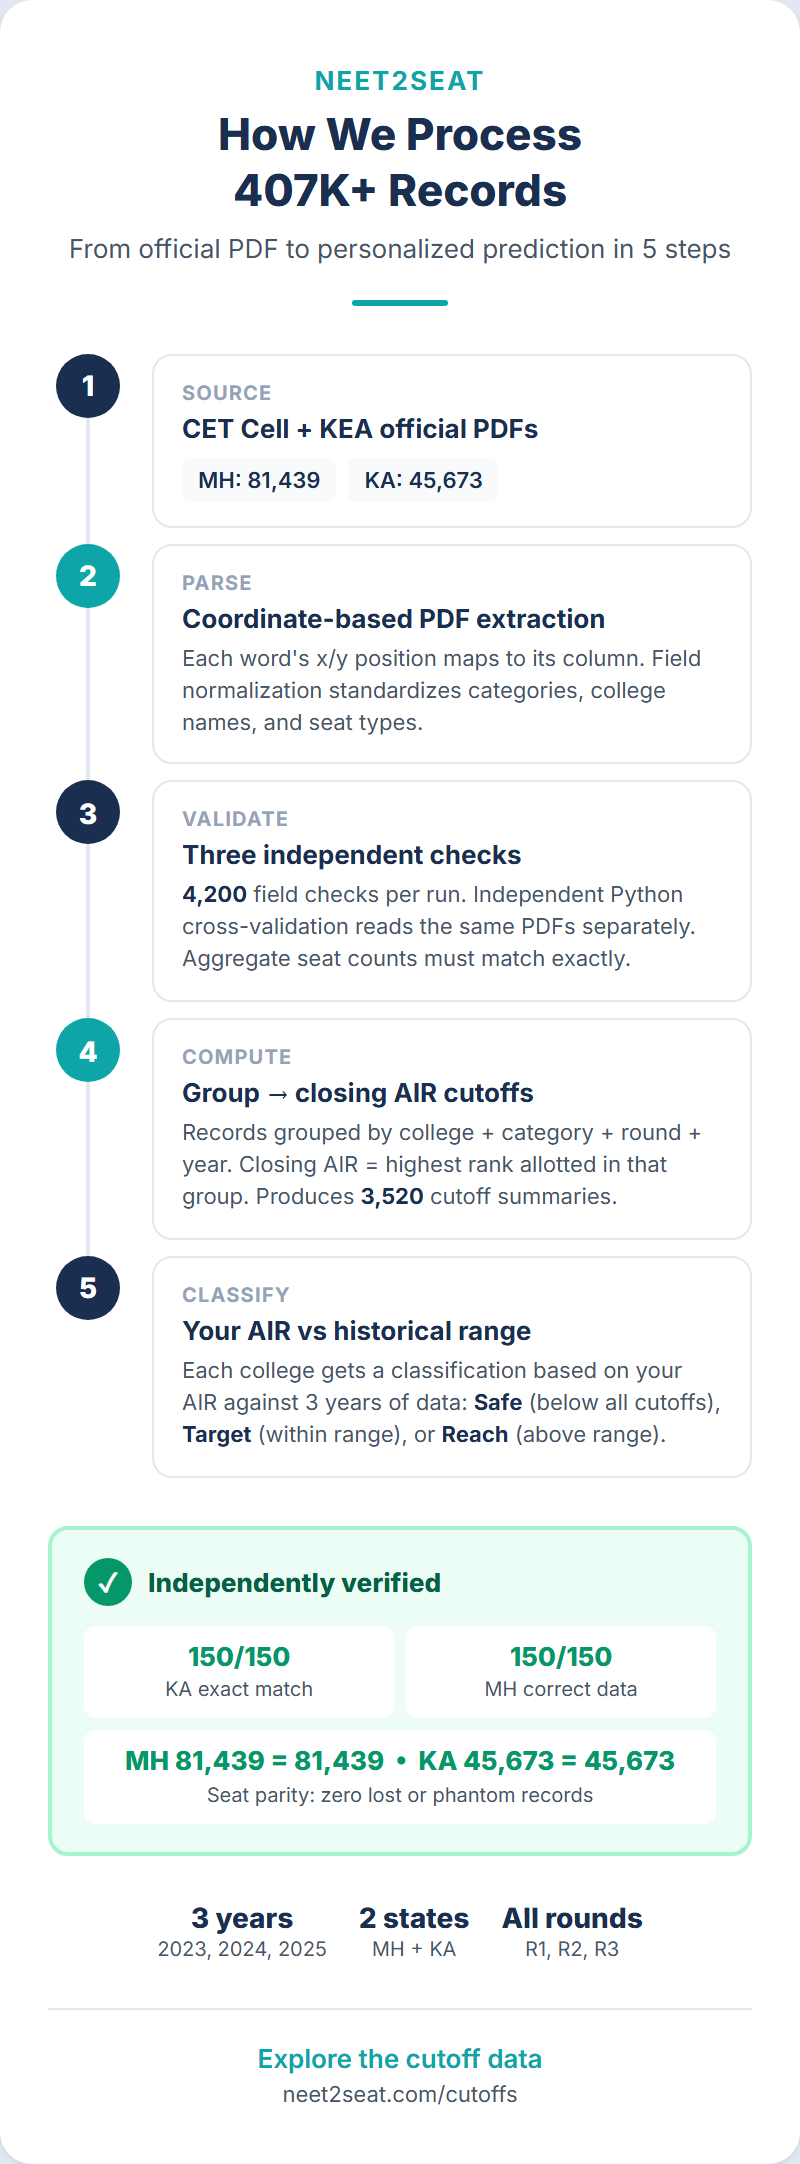
This guide explains exactly how we collect, parse, validate, and present that data, so you can evaluate the reliability of the information you are using to make counselling decisions.
- All data comes from 407,658 official allotment records extracted from CET Cell (MH) and KEA (KA) PDFs
- Three-layer verification: automated field checks (4,200 checks), independent PDF reader (300 rows cross-validated), aggregate seat parity
- Closing AIR = the highest (worst) rank allotted at a college for a given category, round, and year
- Data covers Maharashtra, Karnataka, and All India Quota for 2023, 2024, and 2025
Data sources
Our database covers two states:
- Maharashtra: CET Cell publishes allotment lists for each counselling round as PDF documents. These list every allotted candidate with their NEET AIR, allotted college, category, seat type, and allotment status (joined, did not join, upgraded, etc.).
- Karnataka: KEA publishes similar allotment lists for each round (R1, R2, R3) as PDF documents.
The data covers three academic years: 2023, 2024, and 2025. Across both states and all rounds, the database contains 407,658 individual allotment records.
Why PDFs and not APIs
Neither CET Cell nor KEA provides structured data feeds. Allotment results are published as PDF files on their official websites. These PDFs contain tabular data (rows and columns), but the format, layout, column positions, and even column names vary between states, between years, and sometimes between rounds within the same year.
This means every data point in our system was extracted from a PDF using custom parsers built specifically for each state’s format. The parsing process is the most technically challenging part of the pipeline, and getting it right determines the quality of everything downstream.
Our data source is deterministic: official government PDFs, not surveys, forums, or self-reported data. Every number on neet2seat can be traced back to a specific row in a specific PDF published by CET Cell or KEA. This is what makes the predictions reliable — they are based on what actually happened, not what someone remembered or estimated.
The parsing pipeline
Step 1: PDF extraction
Each PDF is processed using a coordinate-based extraction system. Rather than relying on text-flow order (which is unreliable in complex PDF tables), the parser identifies column boundaries by their x-coordinates on the page and assigns each text element to the correct column based on its position.
This approach handles the most common PDF parsing challenges: merged cells, misaligned columns, multi-line cell values, and rotated pages. Maharashtra’s 2023 and 2025 PDFs, for example, have pages rotated 90 degrees, requiring the parser to transform coordinates before column assignment.
Step 2: Field normalisation
Raw PDF text contains inconsistencies that need normalisation before the data is usable:
- College names: The same college may appear with different spellings, abbreviations, or formatting across years. “Govt Medical College” vs “Government Medical College” vs “GMC” all refer to the same institution. Our pipeline maps these variants to a canonical name using a combination of college codes (which are consistent) and a name-cleaning pipeline.
- Category codes: Maharashtra uses compound category codes (OPEN, OBC, SC, ST, VJA, NTB, NTC, NTD, SEBC, EWS, plus female suffixes like OPENW, SCW, and special quota suffixes like OPENDEF, OPENPH). Karnataka uses base categories with suffix codes (GM, 2AG, 2AK, 2AH, etc.). Each state’s category system is normalised to a consistent internal representation.
- AIR values: Parsed as integers after stripping commas, periods, and whitespace.
- Seat types: Mapped to consistent labels (state_quota, institutional_quota, management_quota, etc.).
Step 3: Validation
Parsed records go through multiple validation checks:
- Range checks: AIR values must be positive integers within the expected range (1 to ~2,000,000). Category codes must match the known set for each state. College codes must exist in the colleges collection.
- Cross-reference: College codes from allotment records are matched against the colleges database (sourced from NMC data). Records with unrecognised college codes are flagged for manual review.
- Duplicate detection: The same candidate (identified by AIR + category + round) should not appear twice in the same round’s allotment.
- Aggregate checks: Total seat counts from parsed data are compared against official seat matrix numbers published by the counselling authority. Maharashtra’s total matches at 81,439 records. Karnataka’s total matches at 45,673 records.
You can verify our data independently. Download any allotment PDF from the CET Cell or KEA website and compare specific entries against the cutoff analyzer. The numbers should match. If you find a discrepancy, contact us — data accuracy is the foundation everything else builds on.
Independent verification
We run three layers of verification to ensure data accuracy:
Layer 1: Pipeline consistency checks
An automated script (verify-data.ts) performs 4,200 field-level checks across 25 randomly selected colleges, comparing parsed values against manually read values from the source PDFs. Karnataka produces 0 mismatches. Maharashtra produces 22 mismatches, all traced to migration-era formatting differences (not incorrect data).
Layer 2: Independent PDF reader
A separate Python script (cross-validate.py) reads the same source PDFs using a completely different PDF parsing library (pdfplumber + PyMuPDF) and independently extracts data. We compare 300 rows across 6 PDFs (3 Maharashtra years + 3 Karnataka years). Karnataka: 150 out of 150 exact matches. Maharashtra: 150 out of 150 correct data values (21 cosmetic spacing differences, 0 actual errors).
The independent reader uses a different technology stack (Python vs TypeScript), different extraction logic, and different column detection methods. Agreement between two independent implementations provides strong evidence that the data is correct.
Layer 3: Aggregate seat parity
The total number of records in our database matches the total published by the counselling authorities. Maharashtra: 81,439 equals 81,439. Karnataka: 45,673 equals 45,673. No records were lost during parsing, and no phantom records were created.
How cutoff summaries are computed
The raw allotment data contains individual records (one per allotted candidate). Cutoff summaries aggregate these records to answer the question: “What was the closing AIR for [college] in [category] in [round] in [year]?”
The computation:
- Group allotment records by college, category, round, and year.
- Within each group, find the maximum AIR (the highest-numbered rank, i.e., the least competitive candidate who was allotted). This is the “closing AIR” or “last rank allotted.”
- Also compute: the minimum AIR (most competitive allottee), the count of allotments, and the median AIR.
The closing AIR is the most useful number for counselling decisions because it answers: “What was the worst rank that still got a seat at this college in this category and round?” If your AIR is better (lower number) than the closing AIR, you would have been allotted. If worse, you would not have been.
How the college predictor works
The college predictor takes your AIR, state, and category, then classifies every college as Safe, Target, or Reach based on historical closing AIRs
The classification logic:
- Safe: Your AIR is below (better than) the closing AIR at this college in your category across all recent years. You would have been allotted in every year we have data for.
- Target: Your AIR is near the closing AIR. In some years you would have been allotted; in others you would not. The outcome depends on the specific year’s cutoff variation.
- Reach: Your AIR is above (worse than) the closing AIR in all recent years. Based on historical data, you would not have been allotted. However, cutoffs can shift, and a Reach college is not impossible.
The boundaries between Safe, Target, and Reach are calculated using the range of closing AIRs across available years. Year-to-year variance at each college determines how wide the Target band is. Colleges with volatile cutoffs have wider Target bands; colleges with stable cutoffs have narrower ones.
What the data does not cover
Transparency about limitations is as important as the data itself:
- MCC (All India Quota) data: Our current database covers state counselling only (CET Cell for Maharashtra, KEA for Karnataka). MCC AIQ allotments, deemed university central counselling, and AFMC are not included.
- Management quota allotments: Private college management quota seats are filled through separate processes. Our data covers government quota and institutional quota seats filled through state counselling.
- Individual preference lists: We know which candidates were allotted where, but not what preference lists they submitted. We cannot tell you how many candidates listed a specific college, only the closing rank of those who were allotted.
- Post-allotment outcomes: We know whether a candidate was allotted and (in some rounds) whether they joined, upgraded, or exited. We do not have data on final graduation, NEET PG scores, or career outcomes.
The predictor covers state counselling data only. If you are also participating in MCC (All India Quota) or deemed university central counselling, those cutoffs are separate. Check MCC’s website for AIQ cutoff data alongside our state-level predictions.
Data freshness and updates
Allotment data is added after each counselling cycle completes. The current database includes:
- Maharashtra: 2023, 2024, 2025 (all rounds)
- Karnataka: 2023, 2024, 2025 (R1, R2, R3)
When new allotment PDFs are published (after the 2026 counselling cycle, for example), they will be parsed and added to the database. Cutoff summaries and predictor classifications update automatically when new data is loaded.
FAQ
Can I verify the data myself?
Yes. The source PDFs are publicly available on the CET Cell (cetcell.mahacet.org) and KEA (kea.kar.nic.in) websites. Download any round’s allotment list and compare specific entries against what our cutoff analyzer shows. The data should match.
Why do some colleges show “no data” for certain years or rounds?
If a college did not participate in state counselling in a specific year (new college not yet approved, or seats removed due to NMC compliance issues), no allotment data exists. Similarly, if a specific category had zero allotments at a college in a round (the seat went unfilled), no closing AIR can be computed.
How does the predictor handle colleges with only one or two years of data?
Colleges with limited historical data produce less reliable classifications. The predictor still computes Safe/Target/Reach based on available years, but the confidence is lower. A college with three years of data has a more stable cutoff range than one with only one year. The predictor does not explicitly display a confidence level, but you should treat single-year data with more caution than multi-year data.
Are the closing AIRs in the cutoff analyzer exact?
Yes, within the scope of the parsed data. The closing AIR shown for a given college-category-round-year is the maximum AIR from the allotment records in our database for that combination. It matches the source PDF. If the source PDF contains an error (misprint by the counselling authority), our data would reflect that error.
Why does the predictor sometimes show different results than what I calculate manually from cutoffs?
The predictor considers all available years and rounds when classifying a college. If you are looking at only one year’s data in the cutoff analyzer, you might see a college as “Safe” based on that year, while the predictor classifies it as “Target” because another year’s cutoff was tighter. The predictor is more conservative by design: it accounts for the full range of historical variation.