- Round 2 cutoffs ease by 15% to 25% at mid-tier government colleges, but only 5% to 10% at top-5 colleges.
- Private college Round 2 shifts are volatile (10% to 60%) and harder to predict from historical data.
- A small percentage of colleges (5% to 10%) can actually tighten in Round 2 due to seat additions or cross-counselling timing.
- Use multi-year historical averages as directional guides, not exact forecasts; actual shifts can vary 5% to 10% from the average.
Round 2 cutoffs are not Round 1 cutoffs minus a few thousand ranks
The most common assumption candidates make about Round 2 is that closing AIRs simply ease by a predictable margin: “Round 1 closed at 15,000, so Round 2 will close around 18,000.” The reality is more complex. Round 2 cutoffs shift for specific structural reasons, and those reasons vary by college type, category, state, and year. Some colleges ease substantially. Others barely move. A few actually tighten.
This guide explains the mechanics behind Round 2 cutoff changes, using actual patterns from our database of 407,000+ allotment records across Maharashtra and Karnataka (2023 to 2025). For state-specific choice filling strategy, see our Maharashtra guide and our Karnataka guide.
Why Round 2 cutoffs change at all
Round 2 has a different candidate pool and a different seat pool than Round 1. Both changes push cutoffs in specific directions.
The candidate pool shrinks
After Round 1, some candidates exit permanently:
- Candidates who chose to freeze (MCC) or Choice 1 (Karnataka) are gone. They accepted Round 1 seats and left counselling.
- Candidates who took free exit (Maharashtra Round 1) re-enter Round 2, but any candidates who secured seats in other tracks (MCC, other state counselling, deemed university direct admission) may not return.
A smaller candidate pool means less competition for the same seats, pushing closing AIRs higher (less competitive).
The seat pool changes
Seats available in Round 2 are not the same as Round 1:
- Newly vacated seats: Seats from candidates who took free exit (Maharashtra) or chose Choice 3 (Karnataka) become available.
- Float/upgrade seats: Seats from candidates who are upgraded in Round 2 are released for others.
- New additions: NMC may approve additional seats between rounds. Some colleges add capacity.
- Removed seats: Seats at colleges with compliance issues may be withdrawn.
The net effect varies: the seat pool usually grows slightly in Round 2 compared to the seats available after Round 1 freezes and exits are processed.
What our data shows about Round 2 shifts
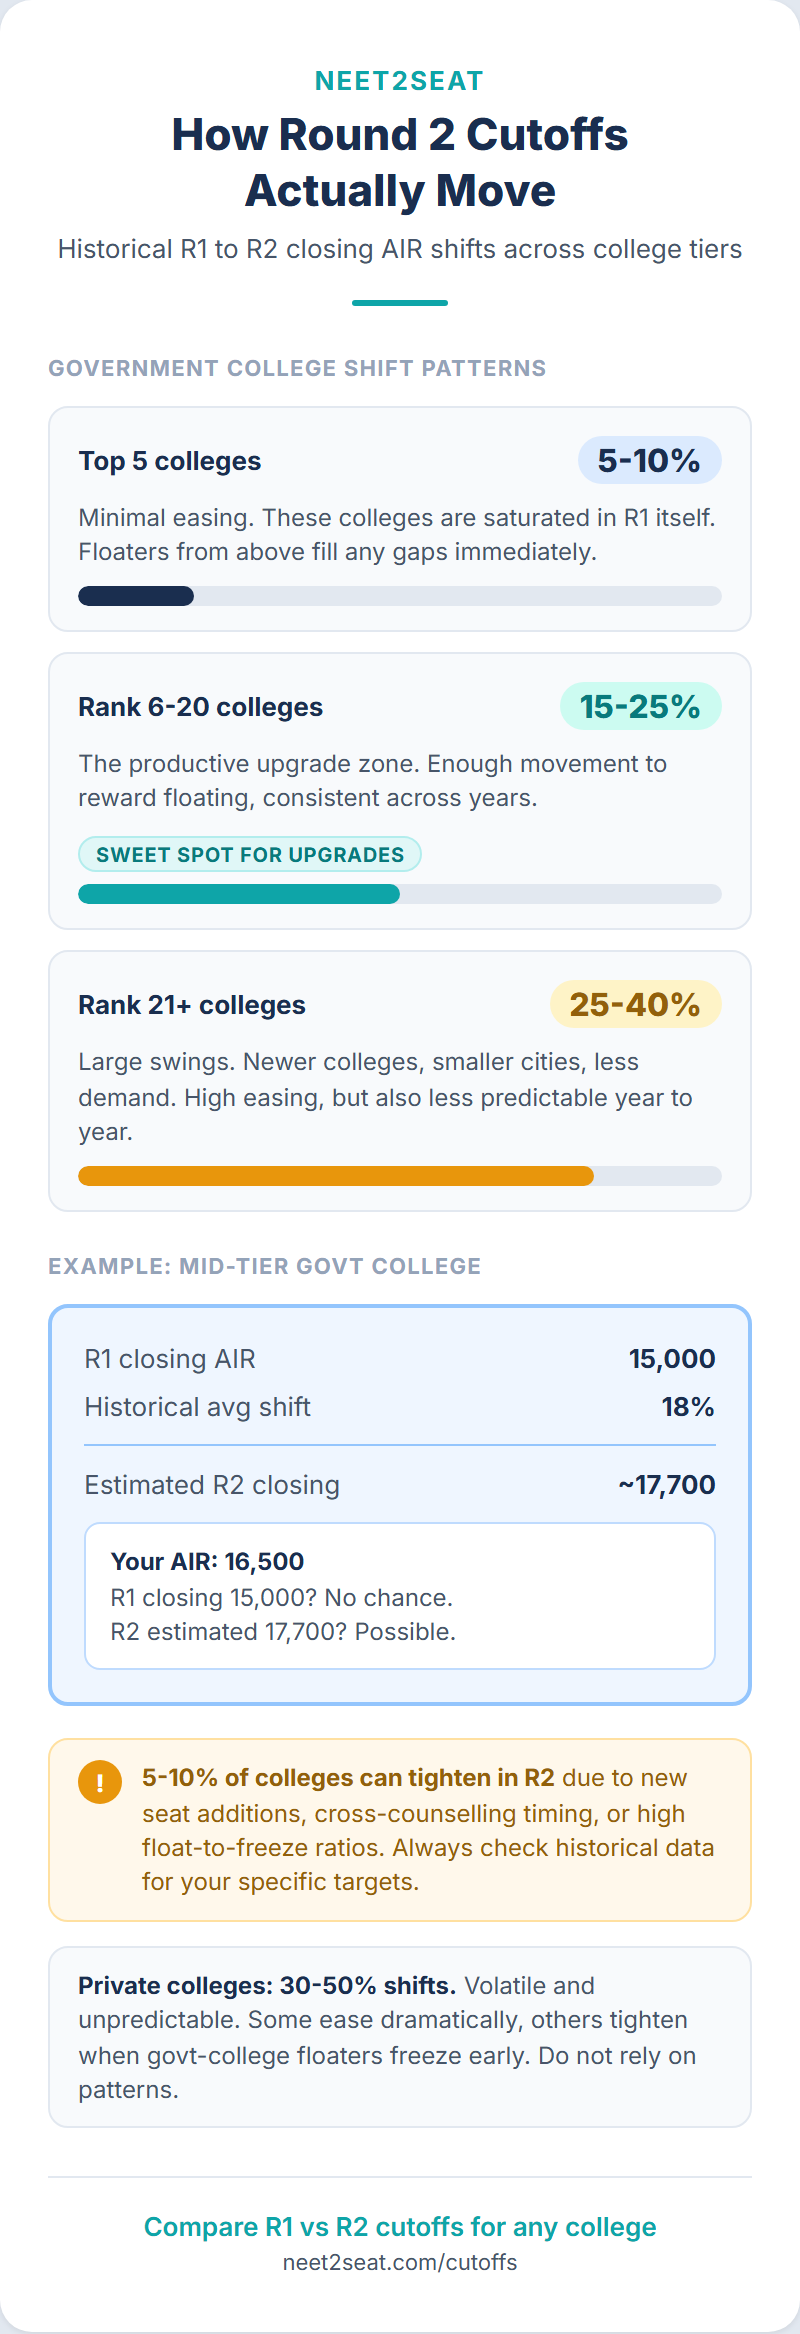
Government colleges: consistent easing at mid-tier, minimal at the top
Across 2023 to 2025 in Maharashtra, the pattern at government colleges is remarkably consistent:
Top-5 government colleges (Seth GS, Grant, BJ Medical Pune, LTMMC Mumbai, GMC Nagpur) ease by only 5% to 10% in Round 2. These fill with top-ranked candidates who freeze immediately. Mid-tier colleges (ranked 6th to 20th) ease by 15% to 25%: the sweet spot for upgrades. Colleges ranked 21st and below can ease by 30% to 40%, especially in smaller cities.
Karnataka follows a similar pattern. Bangalore Medical College and Mysore Medical College show 5% to 15% easing in Round 2. Government colleges in Bellary, Shimoga, Mandya, and similar cities show 15% to 30% easing.
Private colleges: volatile and unpredictable
Private college Round 2 cutoffs are harder to predict from Round 1 data alone. The reasons:
- Fee changes: Some private colleges adjust fee structures between rounds or years, affecting demand.
- Seat type mix: The ratio of state quota to management quota to NRI quota seats available in Round 2 differs from Round 1.
- Candidate behaviour: Candidates allotted private seats in Round 1 are the most likely to seek upgrades (to government colleges), creating large Round 2 vacancies at some private colleges.
At competitive private colleges in metropolitan areas (Mumbai, Bengaluru, Pune), Round 2 easing ranges from 10% to 30%. At less competitive private colleges, closing AIRs can jump by 40% to 60% between Round 1 and Round 2, meaning seats that were previously full are now available to candidates with much higher (weaker) ranks.
Category-specific patterns
Reserved category cutoffs do not always move in the same direction as OPEN cutoffs. Patterns we observe:
- SC and ST categories often show larger Round 2 easing than OPEN because fewer reserved category candidates have backup options in other counselling tracks.
- OBC and EWS categories tend to track OPEN movement more closely.
- Karnataka suffix categories (K, R, H, KH, RH) can show erratic Round 2 movement because the candidate pools are smaller. A few candidates leaving the system can shift closing AIRs significantly.
- Maharashtra compound categories (OPENW, SCW, etc.) follow their base category trends but with more volatility due to smaller numbers.
Year-to-year variation: why last year’s Round 2 is not a guarantee
Round 2 cutoff changes are not constant across years. Three factors cause year-to-year variation: overall NEET cohort competitiveness, policy changes (such as Karnataka’s 2025 fee cap), and seat matrix changes (new colleges, added seats, NMC compliance actions). Always use multi-year data rather than a single year’s shift to estimate your Round 2 chances.
Overall competitiveness of the NEET cohort
If the overall NEET exam is easier or harder than the previous year, all cutoffs shift accordingly. In years when NEET scores are higher across the board (easier paper or larger candidate pool), Round 2 cutoffs tighten relative to what historical data would predict.
Policy changes
Karnataka’s 2025 advance fee cap (Rs 12,001 for Choice 2) likely increased the number of candidates using Choice 2 instead of Choice 1 or Choice 3. More Choice 2 candidates means fewer seats vacated after Round 1, which could reduce Round 2 seat availability and temper the expected easing.
Maharashtra’s information bulletin changes (deposit amounts, deadlines, seat matrix modifications) similarly affect candidate behaviour and Round 2 dynamics.
Seat matrix changes
New colleges opening, existing colleges adding seats, or NMC compliance actions removing seats all change the Round 2 seat pool in ways that historical data cannot predict. Maharashtra added several new government medical colleges in recent years, expanding the seat pool. Karnataka’s deemed university government quota allocations change periodically.
How to use Round 1 data for Round 2 decisions
After Round 1 results: (1) Go to the cutoff analyzer and filter for your state, current year, and category. (2) Note Round 1 closing AIRs for each college. (3) Check what Round 2 closing AIRs were in 2023, 2024, and 2025 for the same colleges. (4) Calculate the average Round 1 to Round 2 percentage shift. (5) Apply that average to the current Round 1 closing to estimate Round 2. If your AIR falls within the estimated range, the college is a realistic target.
This is a rough estimation. Actual Round 2 closings can deviate from historical averages. But it is far more reliable than guessing or relying on social media predictions.
Colleges where Round 2 is harder than Round 1
In rare cases, Round 2 closing AIRs at a specific college can be lower (more competitive) than Round 1. This happens when:
- Seats were added after Round 1 at the same college, attracting higher-ranked candidates who missed Round 1 for that institution.
- A popular college that was under-filled in Round 1 (due to late seat addition or initial uncertainty) draws a rush of candidates in Round 2.
- Cross-counselling timing: candidates who were waiting for MCC results before committing to state counselling enter Round 2 with strong AIRs, pushing cutoffs lower at specific colleges.
These cases are uncommon (affecting 5% to 10% of colleges in any given year), but they serve as a reminder that Round 2 easing is a tendency, not a law. Always check multi-year data for your specific target colleges rather than assuming directional movement.
Round 2 vs Round 3 and mop-up: diminishing returns
The magnitude of cutoff easing typically peaks in Round 2 and diminishes in subsequent rounds:
- Round 2: The largest movement. Maximum seat turnover from Round 1 exits and floats. Closing AIRs ease 15% to 25% at most mid-tier colleges.
- Round 3: Smaller seat pool. Movement is 5% to 15% additional easing from Round 2, if any. Some colleges do not have Round 3 seats at all.
- Mop-up: Minimal seat pool. Cutoffs can jump wildly (both easier and harder) because the candidate numbers are small and behaviour is unpredictable.
If your target college did not become achievable in Round 2, the probability of it becoming achievable in Round 3 or mop-up is low (but not zero). See our mop-up round guide for that specific scenario.
FAQ
Do all Round 2 cutoffs ease, without exception?
No. Most colleges see easing in Round 2, but a small percentage (5% to 10%) may see tightening due to seat additions, cross-counselling timing, or other structural factors. Always check multi-year data for your specific target colleges.
Is the percentage easing consistent across categories?
Not exactly. OPEN category easing tends to be the most predictable. Reserved categories with smaller candidate pools (ST, Karnataka suffix codes) show more volatile Round 2 shifts. Use category-specific historical data, not OPEN data, to estimate your Round 2 chances.
Should I count on Round 2 easing when building my Round 1 preference list?
No. Build your Round 1 list based on Round 1 data. Round 2 easing is a potential opportunity, not a planning assumption. If you under-fill your Round 1 list because you are “counting on Round 2,” and Round 2 easing is less than expected, you end up with no seat in either round.
How accurate is the historical average shift as a predictor?
It is the best available predictor, but not precise. Actual shifts can vary 5% to 10% from the historical average in any given year. Use the average as a directional guide, not an exact forecast. The more years of data you average, the more stable the estimate.
Does the cutoff analyzer show Round 2 data separately from Round 1?
Yes. Filter by round to see closing AIRs for each round independently. This lets you calculate Round 1 to Round 2 shifts directly from the data. On the cutoff analyzer, select the specific year and round to compare.